01 The claim, and how to test it
There's a common objection to AI visibility measurement, and it deserves to be taken seriously:
"AI answers are random. Ask the same question twice, you get two different answers. How can you measure that?"
The skeptics are half right.
Individual AI answers do vary. Same prompt, same engine, different day — different wording, different ordering, sometimes different brands. Our own data shows it: the same brand's presence can swing 20 points between engines on the same day.
But there's a second claim hiding inside the objection — that because individual answers vary, there's no stable signal underneath. That claim is testable. So we tested it.
While building Visibl, I wanted to answer the harder version of the trust question: is an AI visibility report detecting a market signal, or just producing a one-off reading of whatever the engines happened to say that day — bent around whichever brand paid for the audit?
There's a name for the check: an inversion test. Run the same measurement twice with opposite subjects. If the instrument is honest, the market shouldn't bend around the subject.
The setup: two audits of the No-Code Website Builder category in the United States. Same 7 AI engines (Claude, GPT-5 Search, ChatGPT, Gemini, Google AI Overview, Google AI Mode, Perplexity). The same 20 category prompts, verbatim — 140 checks per audit, every response collected fresh. The only meaningful variable: which brand the audit was for. Framer was audited on July 8, 2026. Webflow was audited on July 10, 2026.
Both brands are credible players in the same space. Webflow is the more established platform. Framer is newer, strongly associated with modern visual design, startups, and high-polish landing pages. If the system flatters its subject, Framer's report should make Framer look dominant, and Webflow's report should do the same for Webflow.
That is not what happened.
02 Result 1 — The ranking didn't bend
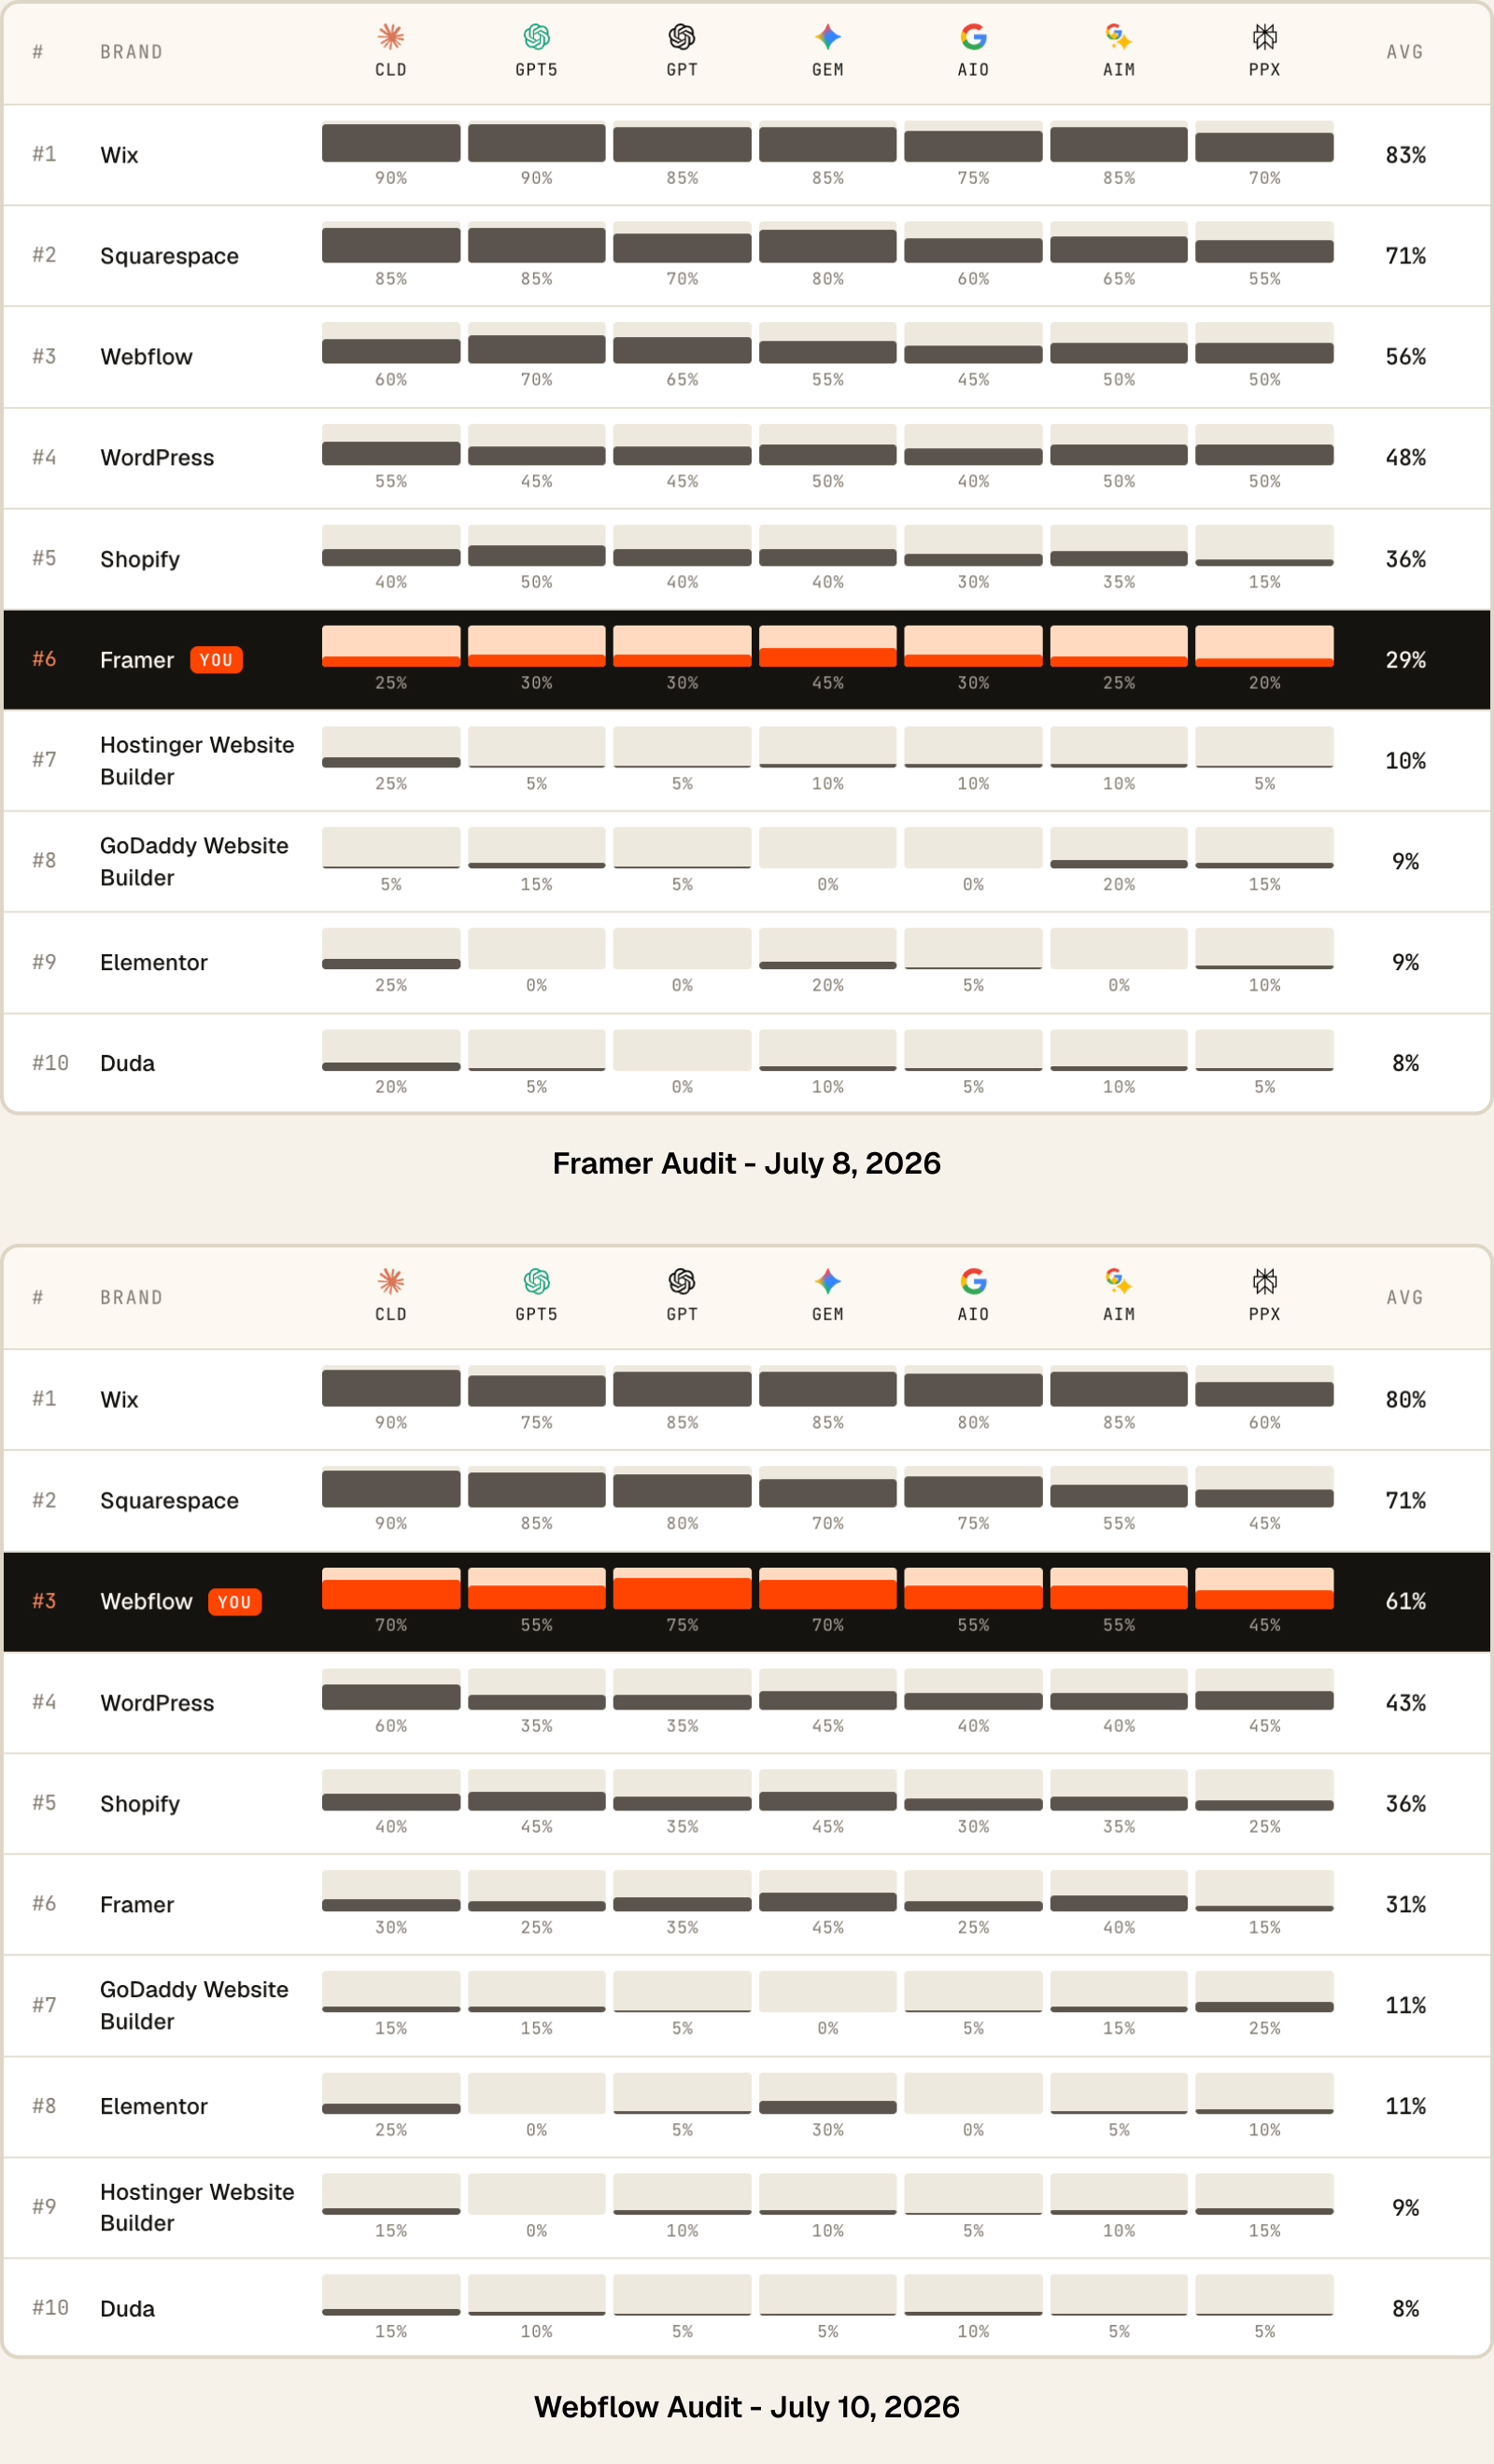
The top six came back in identical order in both audits: Wix (83% / 80%) → Squarespace (71% / 71%) → Webflow (56% / 61%) → WordPress (48% / 43%) → Shopify (36% / 36%) → Framer (29% / 31%).
Three brands returned identical averages across both runs: Squarespace (71/71), Shopify (36/36), and Duda (8/8) at #10.
Positions 7 through 9 shuffle — but look at the numbers: GoDaddy, Elementor, and Hostinger sit within a two-point band (9–11%). With 20 prompts per engine, each cell moves in 5-point steps. A shuffle inside a two-point band is the noise floor behaving like a noise floor. The head of the market is locked; only the tail flickers, exactly where the math says it should.
One level deeper — the per-engine fingerprint repeated too
Aggregate rankings could match by luck. Engine-by-engine profiles are much harder to fake.
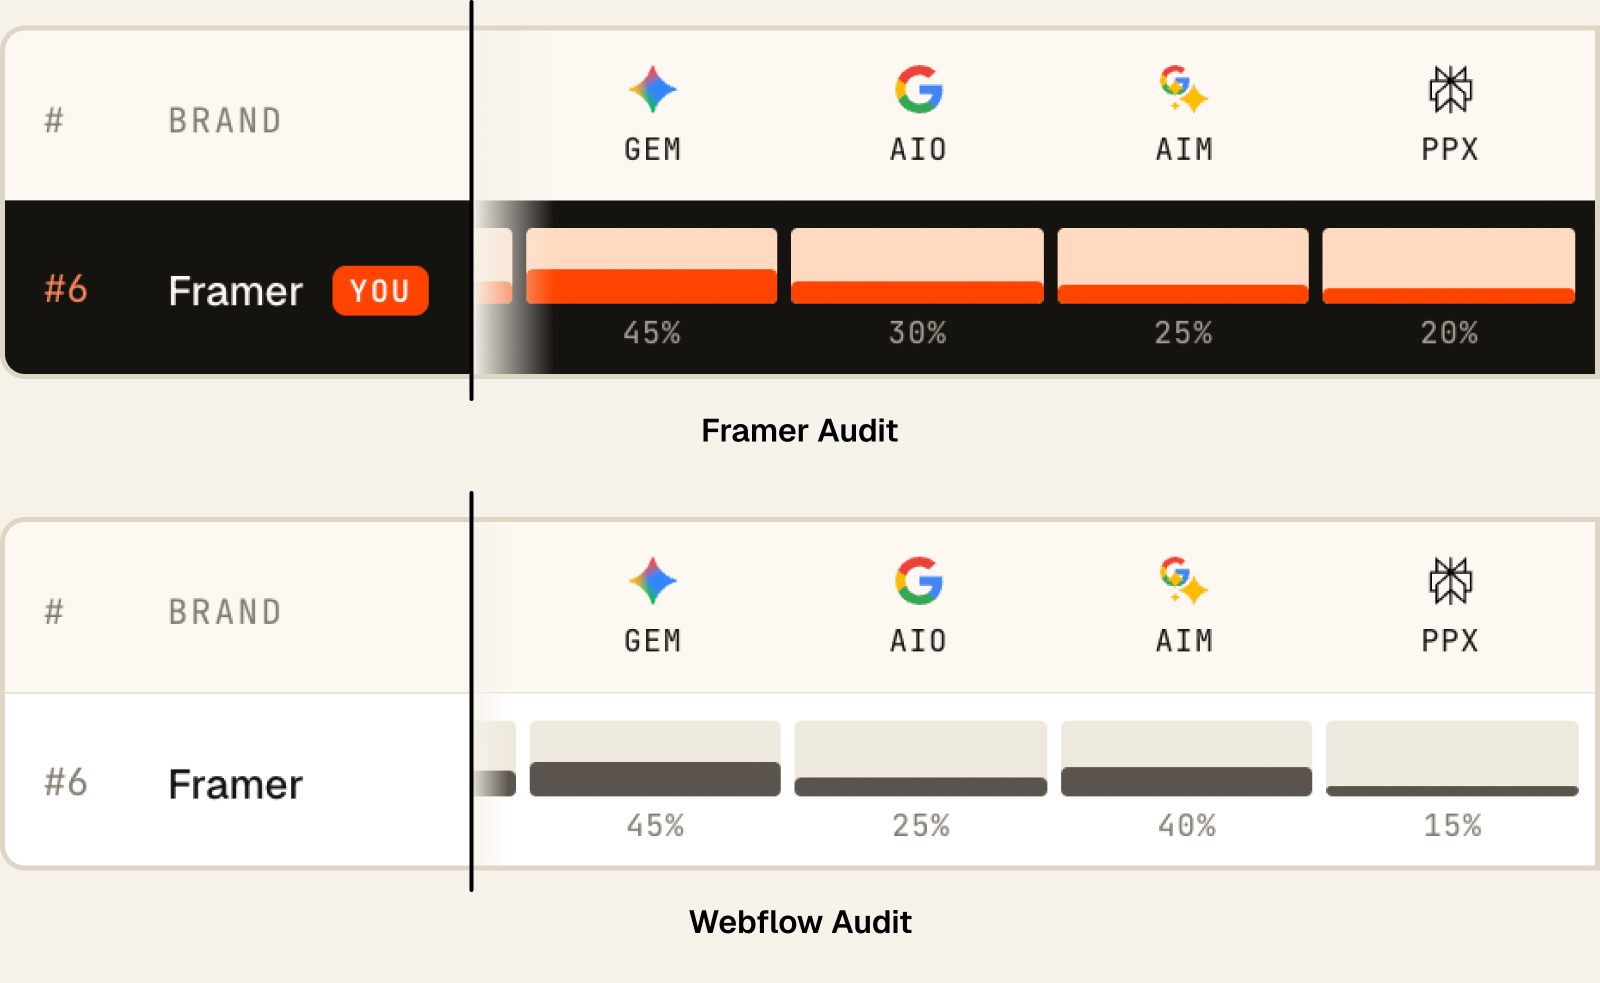
Framer's strongest engine in its own audit was Gemini — at exactly 45%. In Webflow's audit, where Framer was just a bystander brand, Framer's strongest engine was also Gemini, also at exactly 45% — with Perplexity its weakest surface in both. Wix's seven-engine profile matched cell-for-cell on four of seven engines across the two audits (Claude 90/90, ChatGPT 85/85, Gemini 85/85, AI Mode 85/85). Even a tail brand like Elementor reproduced its jagged shape: 25/25 on Claude, 0/0 on GPT-5 Search, 10/10 on Perplexity.
Two independent audits didn't just agree on who ranks where. They reproduced each brand's shape — which engines favor it, which ignore it.
03 Result 2 — Being the audited brand bought nothing
This is the sycophancy check, and it comes down to four numbers.
- Framer measured 29% in its own audit — and 31% when it was just a competitor in Webflow's audit.
- Webflow measured 61% in its own audit — and 56% when it was just a competitor in Framer's audit.
Both deltas sit within one prompt-cell of measurement granularity. Framer actually scored slightly lower in the audit it was the subject of.
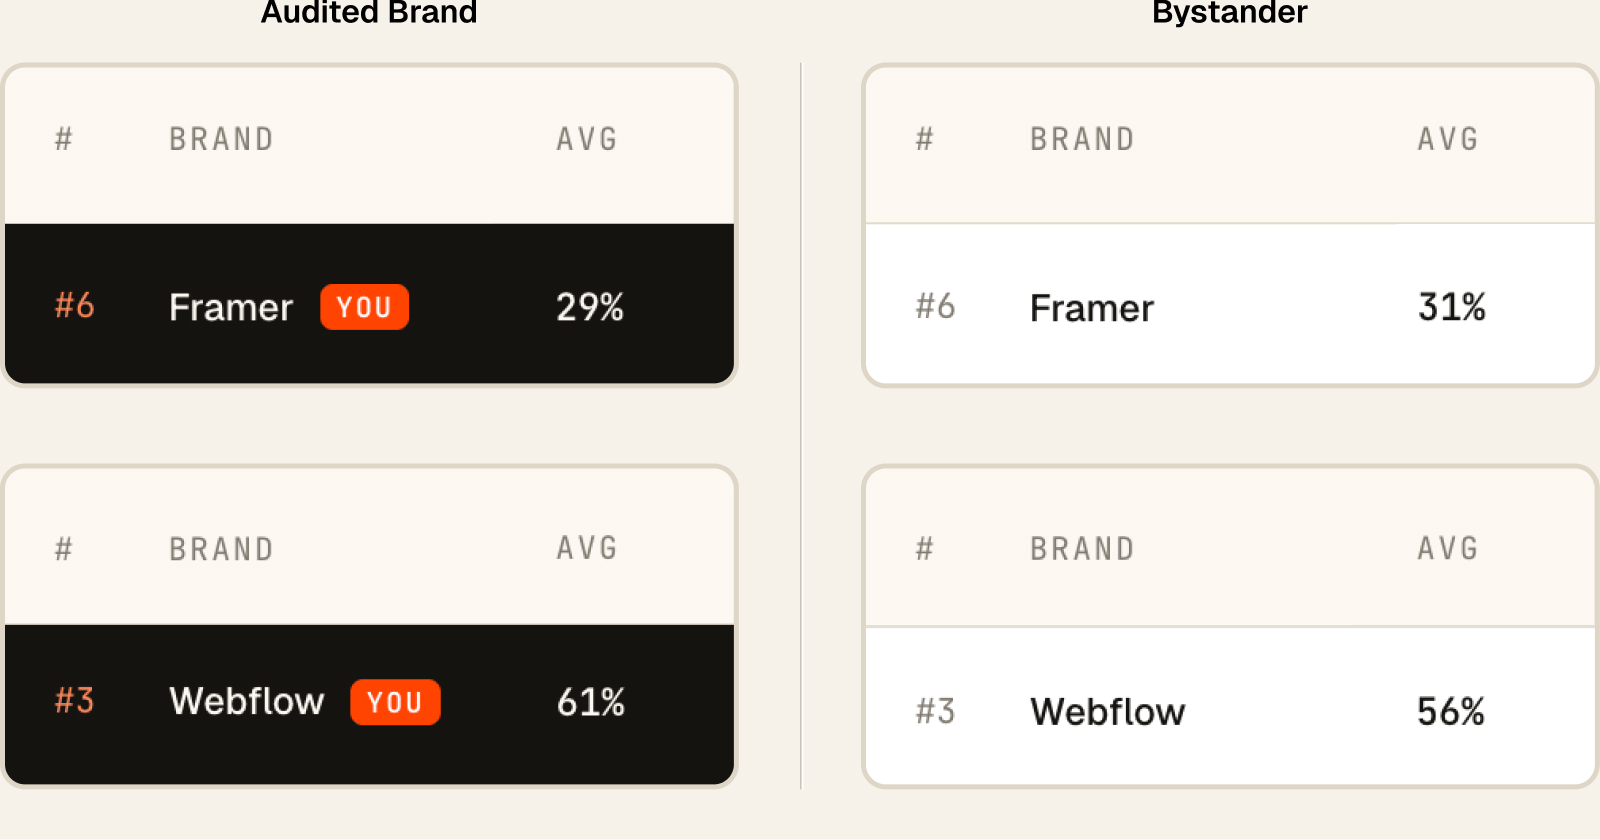
If the system inflated whoever was being audited, these pairs would diverge. They don't. The audited brand gets a deeper report — not a better number.
Part of that is design: the identical 20 prompts ran in both audits. Where a prompt names brands (one compares Webflow and Framer directly), it named them in both runs, for both subjects. The instrument was held constant; the subject was the only variable.
04 Result 3 — The source graph repeated too
AI visibility isn't only about which brands appear — it's about which sources shape the answers. Across roughly 1,350 citations per audit:
- 13 of the top 15 cited domains were the same in both audits.
- reddit.com was cited exactly 45 times in each. tooltester.com: 20 in each. elementor.com: 41 and 40.
- The single most-cited domain in both audits was wix.com — 95 citations in one, 86 in the other.
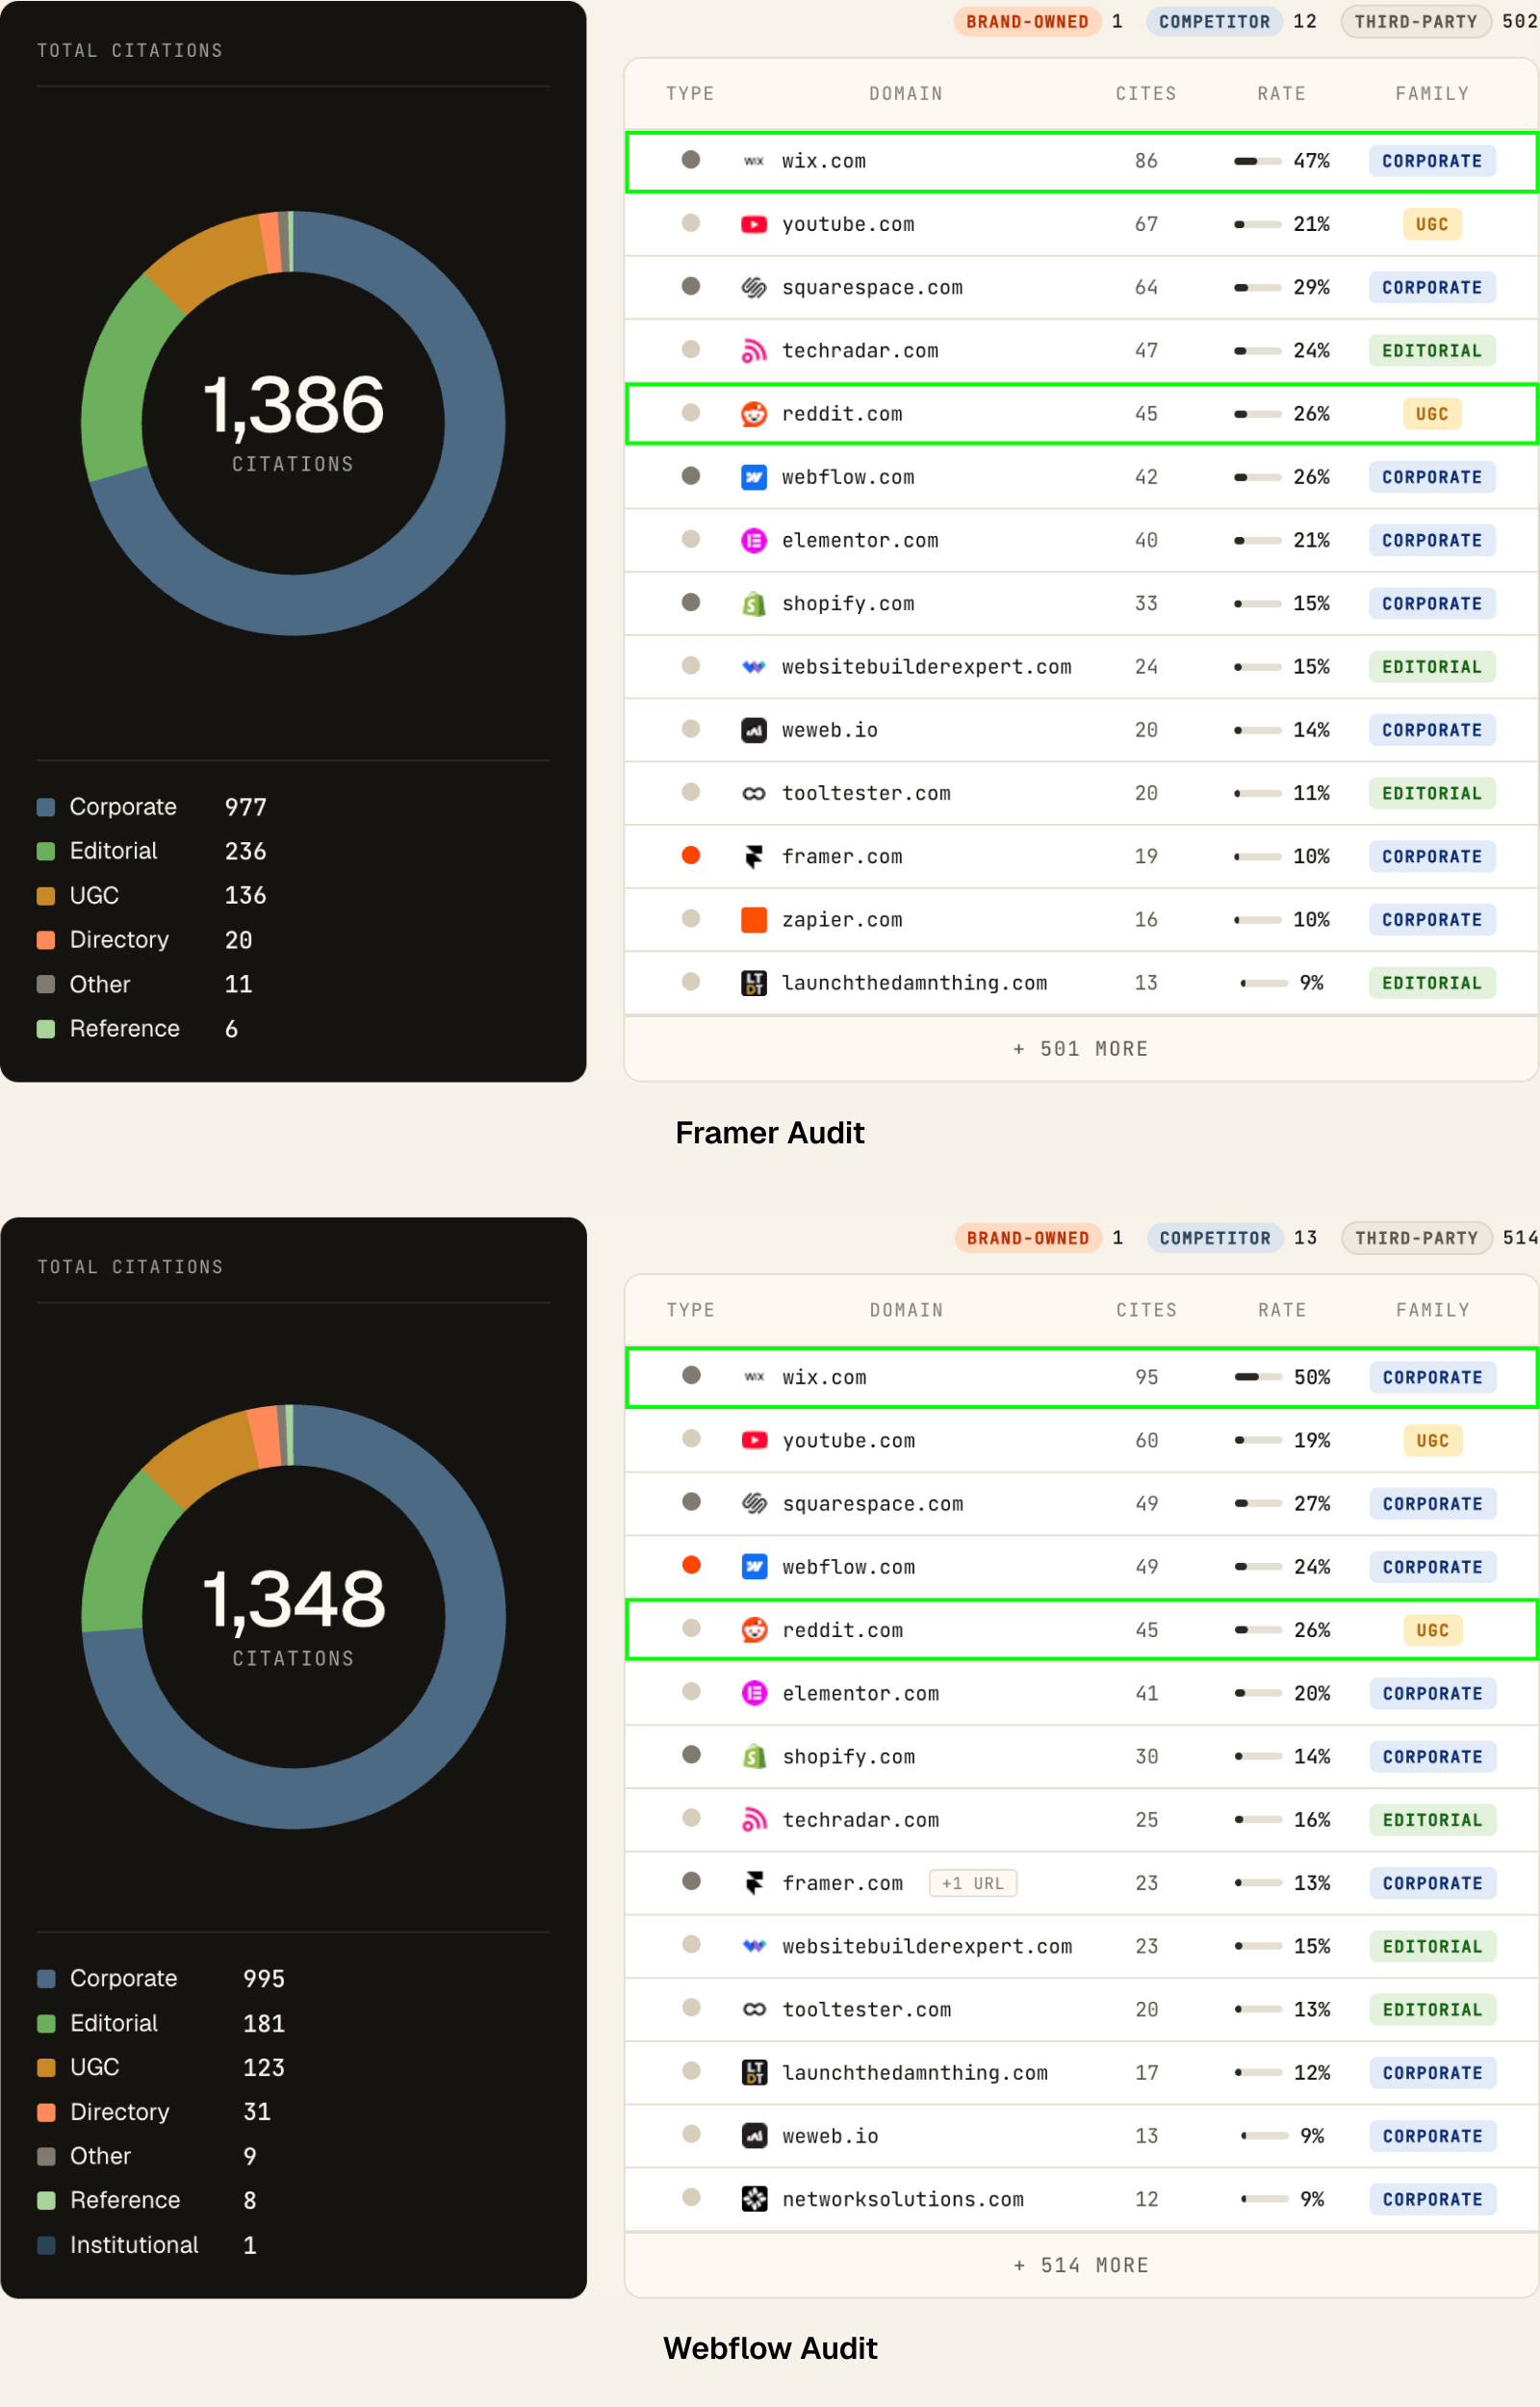
That last one isn't a coincidence; it's the mechanism. The engines draw category understanding from a shared substrate — comparison sites, review roundups, Reddit threads, YouTube, and the platforms' own domains. That substrate doesn't change based on who commissions an audit, which is why the competitive structure repeats. Wix's dominance in answers is anchored in Wix's dominance of the sources those answers cite.
For marketing teams, that's the commercially useful part: if the same sources keep shaping answers regardless of who's asking, those sources are the battlefield.
05 The two-day gap worked against us
The audits were run independently, two days apart — July 8 and July 10.
Engines drift across days: retrieval indexes refresh, source content shifts, and generation is stochastic. All of that drift pushes two audits toward disagreeing. It's a confound that works against the consistency we found.
The rankings matched anyway. Engine drift had every opportunity to break the result. It didn't.
06 What changed — and why that's the useful part
Invariance in the market structure doesn't mean the two reports read the same. They describe two very different strategic positions.
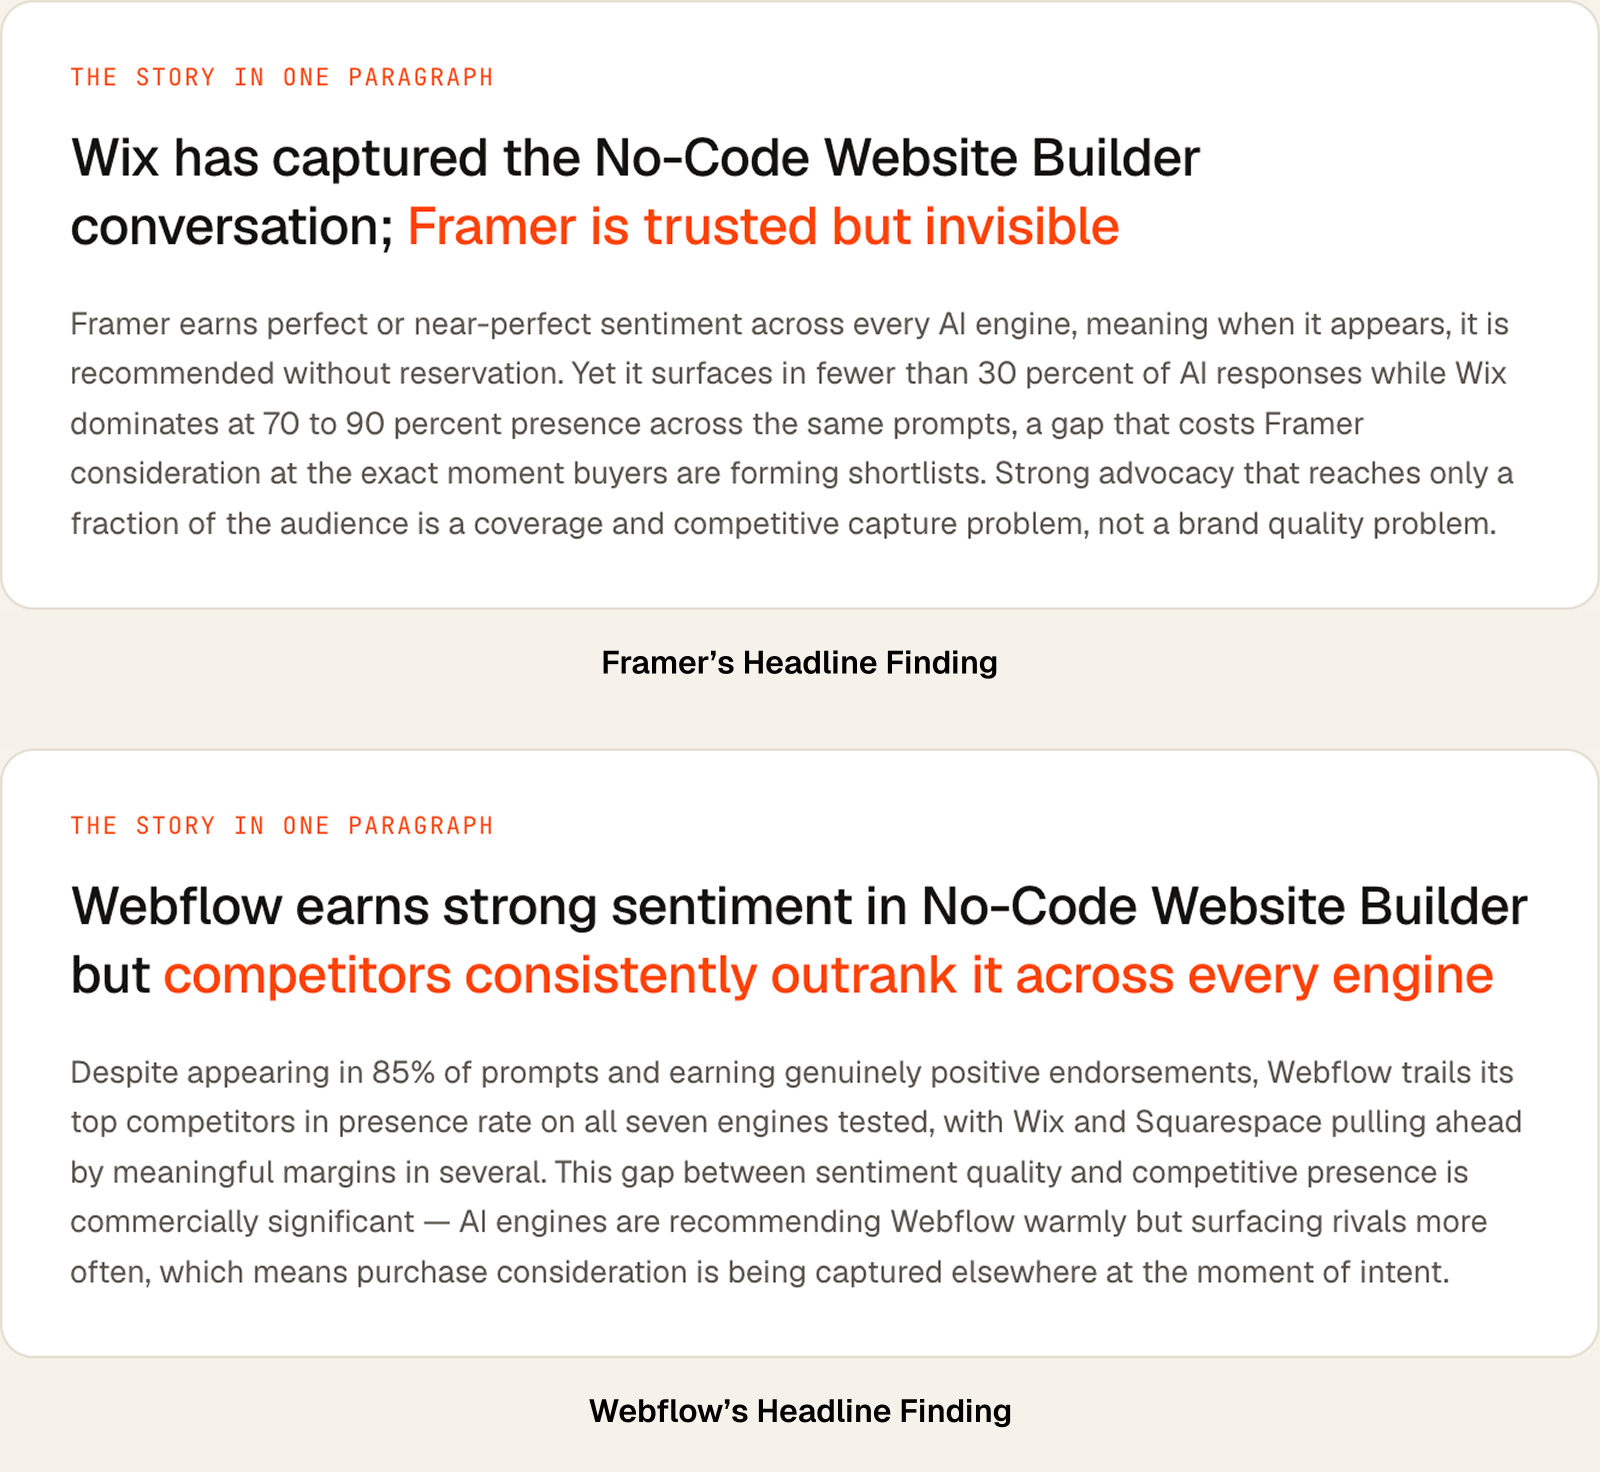
Webflow scored 56.4/100 — strong presence (61% of all checks), positive sentiment, but outranked by Wix and Squarespace on every one of the seven engines. Its problem isn't recognition; it's that at the moment of intent, the engines surface two rivals more often.
Framer scored 32.4/100 — near-perfect sentiment in every engine where it appears, but it appears in under 30% of responses. Trusted but under-covered. Its problem isn't reputation; it's reach inside the category conversation.
One detail worth pausing on: each audit independently described the other brand the same way that brand's own audit did. Webflow's report flagged Framer as "a rising threat" with 35 recommended placements despite lower presence. Framer's report described Webflow as carrying a high concentration of "recommended" framings. Neither report knew the other existed. They corroborate each other anyway.
Those are different strategic problems requiring different moves — which is what an audit is for. A useful report doesn't tell every brand to "appear more." It shows where the brand is already understood, and where the market still defaults to other names.
07 What this doesn't prove
Honest limits, stated plainly:
- This is one category pair, in one market, at one point in time. It's a falsifiable pattern, not a universal law.
- The claim is ordinal, not numeric. Rankings repeated; the percentages carry ±one-cell noise by construction (20 prompts → 5-point steps per engine).
- Head brands in a heavily discussed category are the easiest case for stability. Smaller brands show more engine-to-engine variance — that's a finding from our other audits, and a story for another article.
- Anyone with access to these engines can rerun this test. That's the point of publishing the method.
08 The layer worth measuring
Individual AI answers vary. Market signals repeat.
The wrong question is whether one AI answer mentioned your brand today. The right questions are the ones that stayed stable across 280 checks, two audits, two subjects, and two days: whether the category consistently surfaces your brand, which competitors keep appearing in your place, and which sources are shaping the answers.
That's where AI visibility stops being a screenshot and becomes market intelligence. — Founder, Visibl
That's the layer Visibl is built to measure — and this test is the standard we hold it to.
09 Inspect the evidence
Both audits are linked below. The sections this article's claims rest on — the competitive landscape and the citation source map — are open to view; the full reports (every prompt, every engine answer, gap diagnosis, and recommendations) are available with a free account.
- Framer audit — July 8, 2026 · view report
- Webflow audit — July 10, 2026 · view report
Method notes: Both audits used Visibl's standard pipeline — the same 20 category-derived prompts × 7 AI engines (Claude, GPT-5 Search, ChatGPT, Gemini, Google AI Overview, Google AI Mode, Perplexity), fresh web-surface and API responses per audit, US market. Framer audit run July 8, 2026 (1,386 citations analyzed); Webflow audit run July 10, 2026 (1,348 citations analyzed).